Estimate Kinetic Parameters from Dynamic Data
Dynamic Parameter Estimation
The reaction of phenolphthalein with a base solution follows the 2 reaction sequence given below.
- Reaction 1:
- Irreversible reaction, fast reaction dynamics
- Ph + 2 OH- => Ph(2-) + 2 H2O
- Reaction 2:
- Reversible, slow reaction dynamics
- Ph(2-) + OH- <=> PhOH(3-)
Reaction 1 is very fast and can be assumed to be instantaneous when the phenolphthalein (Ph) is added to a hydroxide solution. We are considering using phenolphthalein as an indicator to determine the residence time of several large CSTR reactors in a pilot plant. Please determine the kinetic parameters for reaction 2 with respect to phenolphthalein associated with the fading of phenolphthalein in sodium hydroxide solutions (reaction orders, A1, A2, Ea1, and Ea2).
An engineer collected time-varying data for a non-isothermal run and needs you to estimate the kinetic parameters. The temperature ranged from about 60 - 140 degF. In order to appropriately size the reactor vessel, engineers need the kinetic parameters with the associated 95% confidence intervals.
Nonlinear Confidence Intervals
Nonlinear confidence intervals can also be visualized as a function of 2 parameters. In this case, both parameters are simultaneously varied to find the confidence region. The confidence interval is determined with an F-test that specifies an upper limit to the deviation from the optimal solution
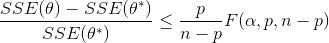
with p=2 (number of parameters), n=number of measurements, theta=[parameter 1, parameter 2] (parameters), theta* as the optimal parameters, SSE as the sum of squared errors, and the F statistic that has 3 arguments (alpha=confidence level, degrees of freedom 1, and degrees of freedom 2). For many problems, this creates a multi-dimensional nonlinear confidence region. In the case of 2 parameters, the nonlinear confidence region is a 2-dimensional space. Below is an example that shows the confidence region for the dye fading experiment confidence region for forward and reverse activation energies.
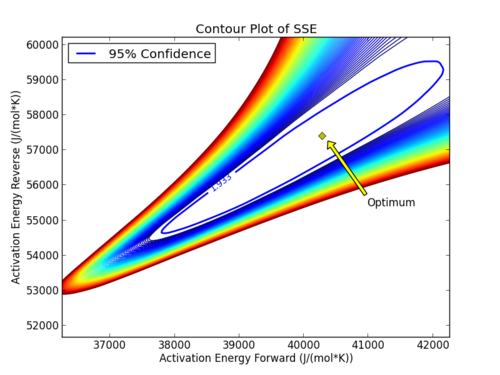
The optimal parameter values are in the 95% confidence region. This plot demonstrates that the 2D confidence region is not necessarily symmetric.
